SplicePlot: a utility for visualizing splicing quantitative trait loci
Wu E, Nance T, Montgomery SB. SplicePlot: a utility for visualizing splicing quantitative trait loci. Bioinformatics. academic.oup.com; 2014;30: 1025–1026.
Cited by: 11
Abstract
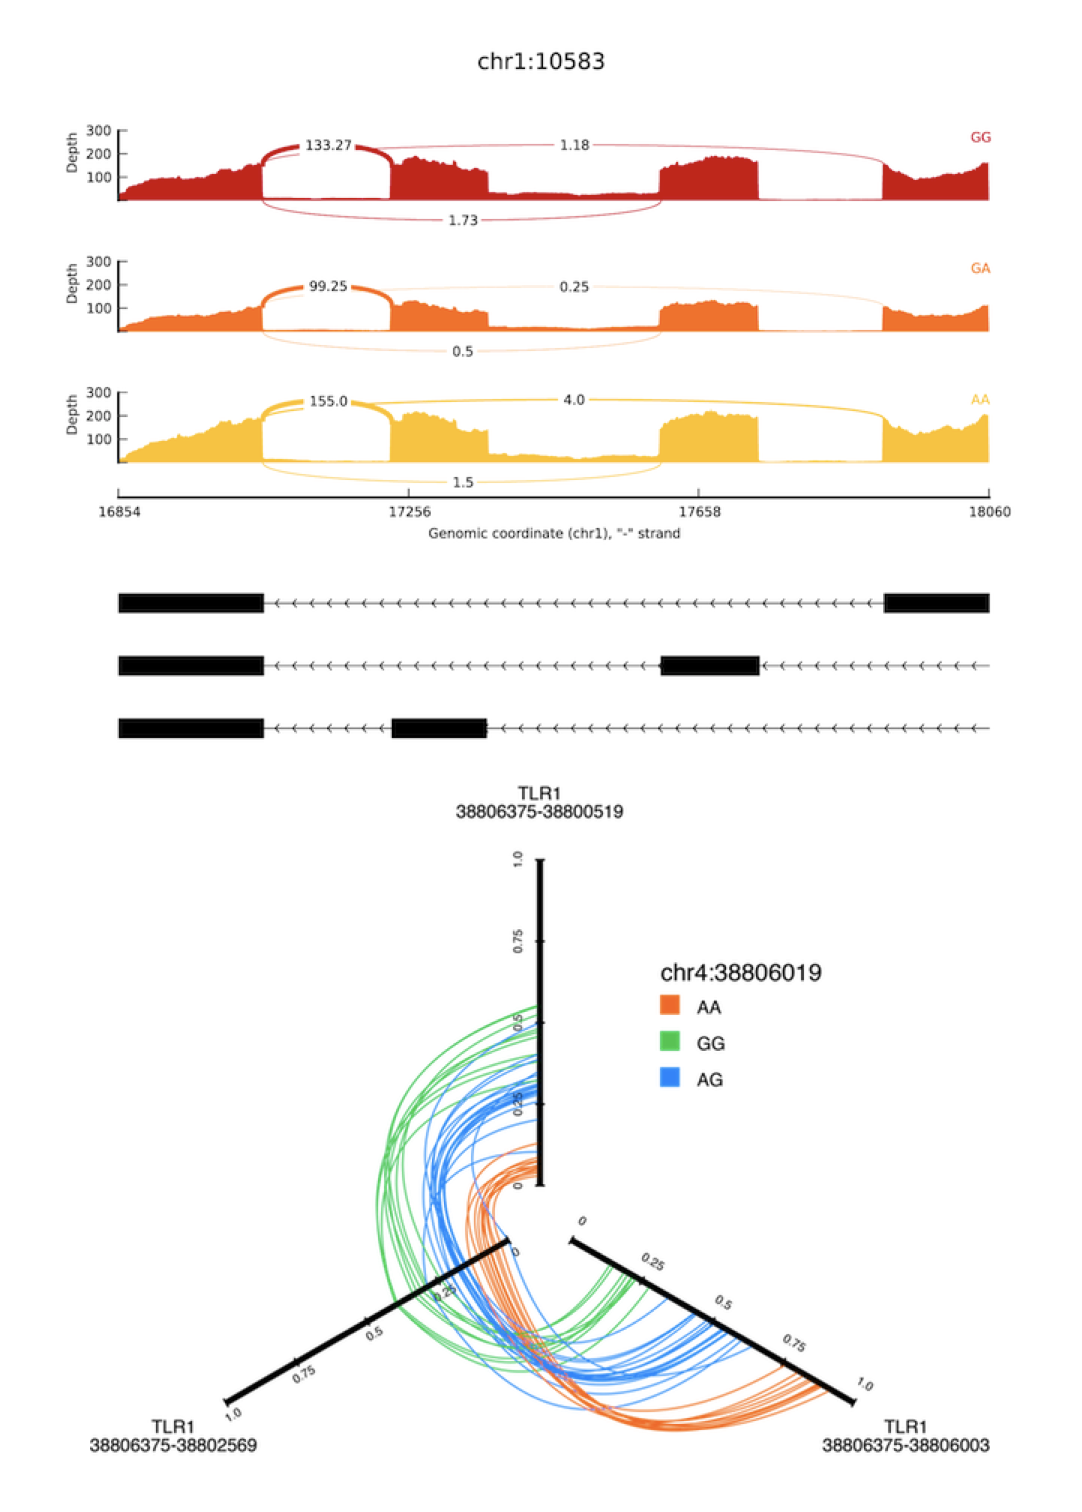
Summary: RNA sequencing has provided unprecedented resolution of alternative splicing and splicing quantitative trait loci (sQTL). However, there are few tools available for visualizing the genotype-dependent effects of splicing at a population level. SplicePlot is a simple command line utility that produces intuitive visualization of sQTLs and their effects. SplicePlot takes mapped RNA sequencing reads in BAM format and genotype data in VCF format as input and outputs publication-quality Sashimi plots, hive plots and structure plots, enabling better investigation and understanding of the role of genetics on alternative splicing and transcript structure. Availability and implementation: Source code and detailed documentation are available at http://montgomerylab.stanford.edu/spliceplot/index.html under Resources and at Github. SplicePlot is implemented in Python and is supported on Linux and Mac OS. A VirtualBox virtual machine running Ubuntu with SplicePlot already installed is also available.
 http://montgomerylab.stanford.edu/spliceplot/index.html