Sequence Surveyor: Leveraging Overview for Scalable Genomic Alignment Visualization
Albers D, Dewey C, Gleicher M. Sequence Surveyor: leveraging overview for scalable genomic alignment visualization. IEEE Trans Vis Comput Graph. ieeexplore.ieee.org; 2011;17: 2392–2401.
Cited by: 44
Abstract
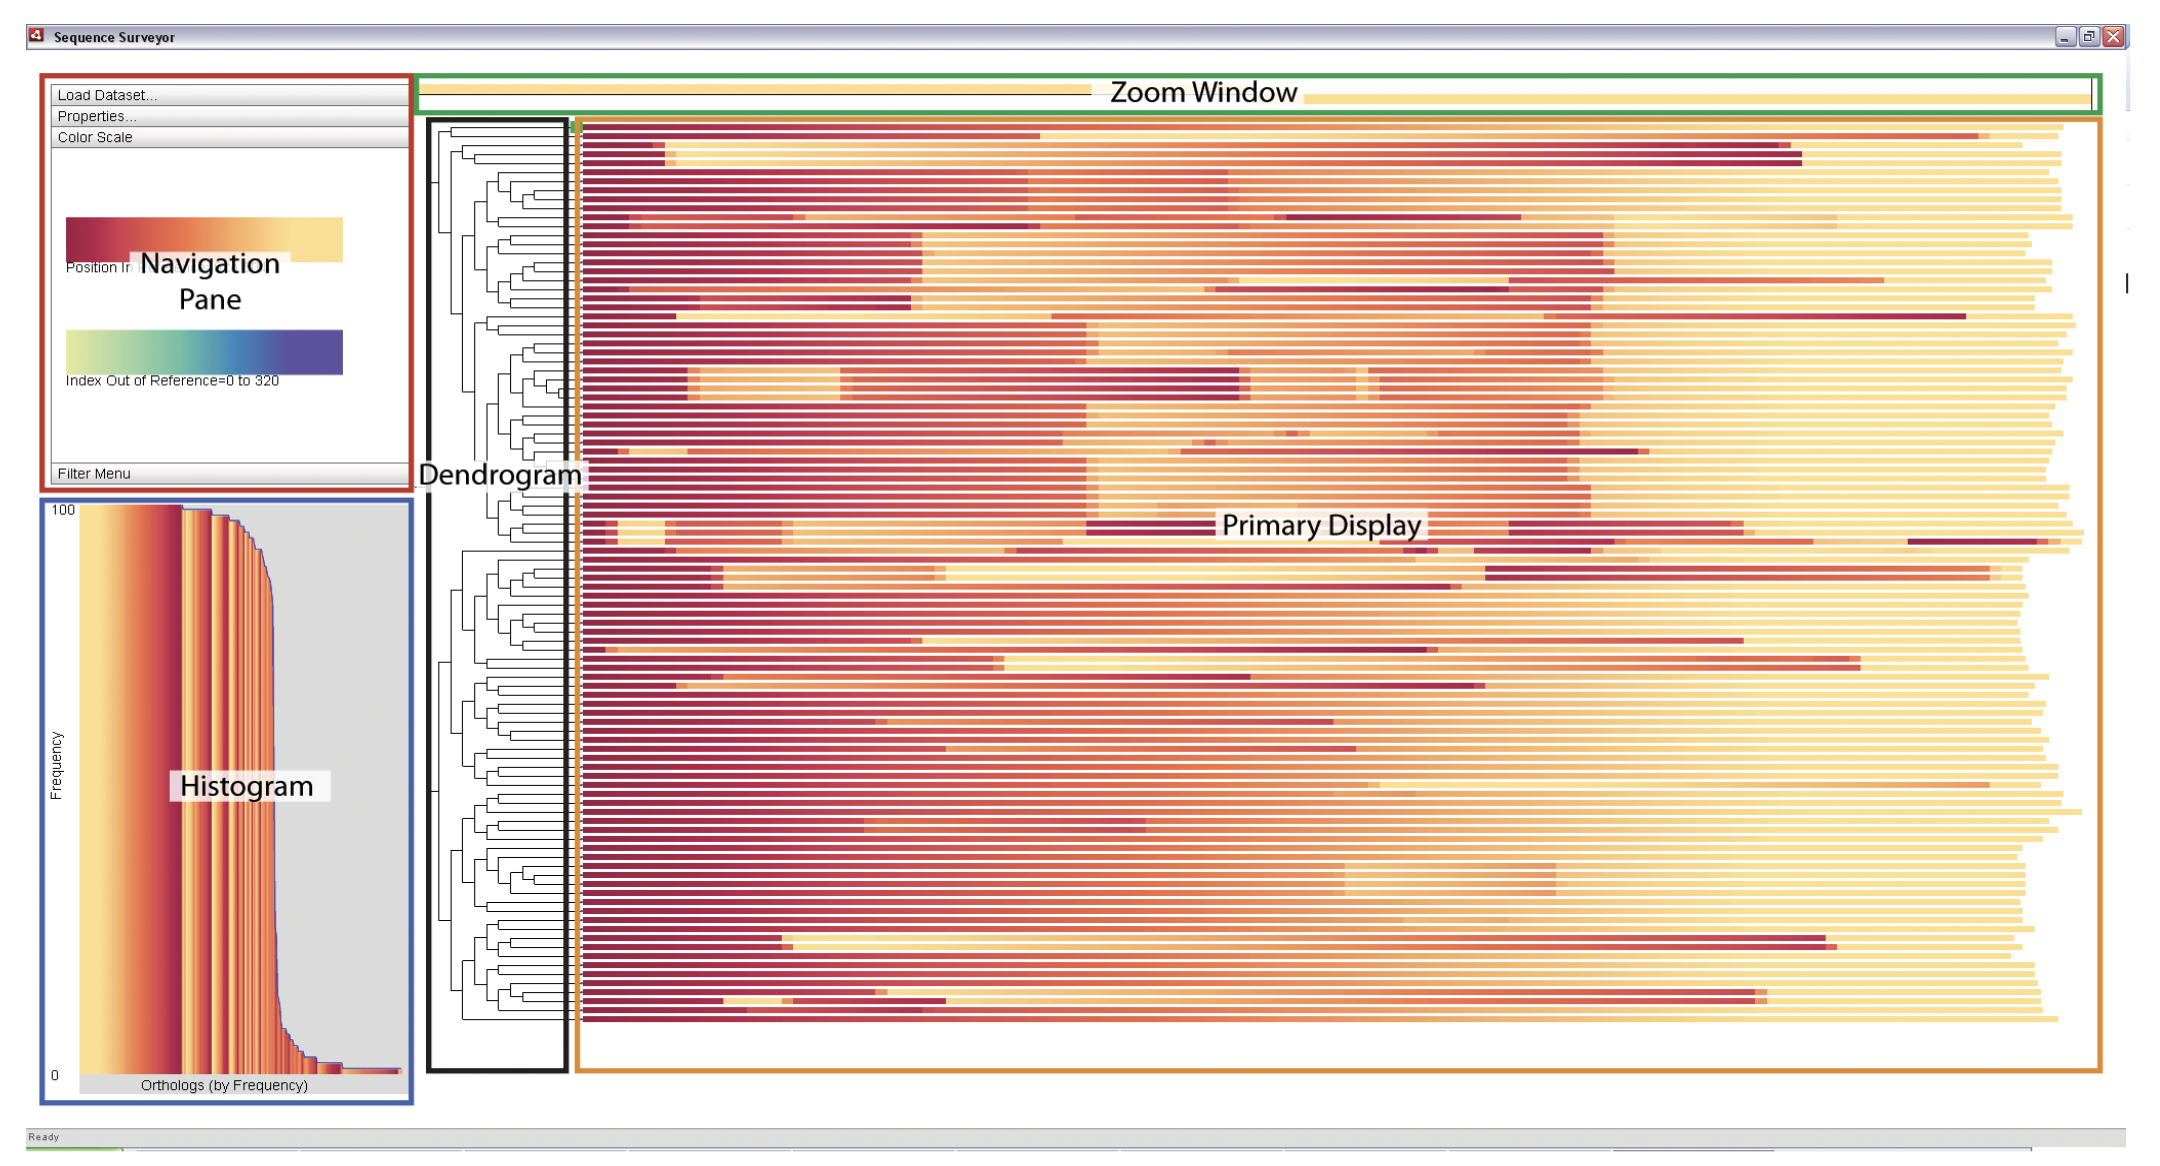
In this paper, we introduce overview visualization tools for large-scale multiple genome alignment data. Genome alignment visualization and, more generally, sequence alignment visualization are an important tool for understanding genomic sequence data. As sequencing techniques improve and more data become available, greater demand is being placed on visualization tools to scale to the size of these new datasets. When viewing such large data, we necessarily cannot convey details, rather we specifically design overview tools to help elucidate large-scale patterns. Perceptual science, signal processing theory, and generality provide a framework for the design of such visualizations that can scale well beyond current approaches. We present Sequence Surveyor, a prototype that embodies these ideas for scalable multiple whole-genome alignment overview visualization. Sequence Surveyor visualizes sequences in parallel, displaying data using variable color, position, and aggregation encodings. We demonstrate how perceptual science can inform the design of visualization techniques that remain visually manageable at scale and how signal processing concepts can inform aggregation schemes that highlight global trends, outliers, and overall data distributions as the problem scales. These techniques allow us to visualize alignments with over 100 whole bacterial-sized genomes.
 https://graphics.cs.wisc.edu/Vis/SequenceSurveyor/SequenceSurveyor_User.html