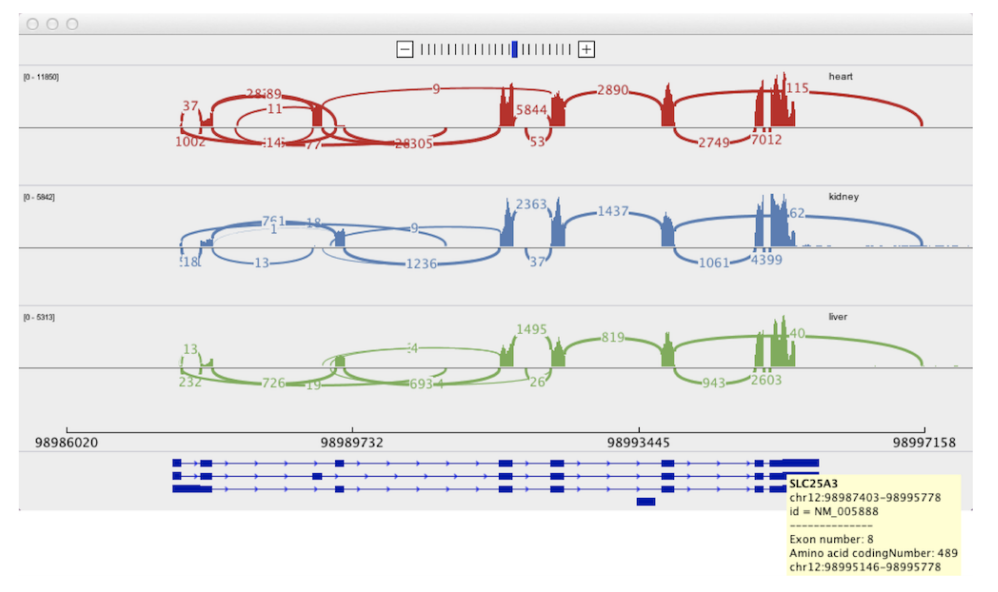
Sashimi Plot
 https://software.broadinstitute.org/software/igv/Sashimi
Methods
linear single view single scale single focus contiguous no abstraction no arrangement within interconnection segment sparse type point sparse typeTool
Tool:
Sashimi PlotDocumentation:
https://software.broadinstitute.org/software/igv/SashimiPaper
Sashimi plots: Quantitative visualization of RNA sequencing read alignments
Katz Y, Wang ET, Silterra J, Schwartz S, Wong B, Mesirov JP, et al. Sashimi plots: Quantitative visualization of RNA sequencing read alignments [Internet]. arXiv [q-bio.GN]. 2013. Available: http://arxiv.org/abs/1306.3466
Cited by: 8