An J, Lai J, Sajjanhar A, Batra J, Wang C, Nelson CC. J-Circos: an interactive Circos plotter. Bioinformatics. academic.oup.com; 2015;31: 1463–1465.
Cited by: 30
Abstract
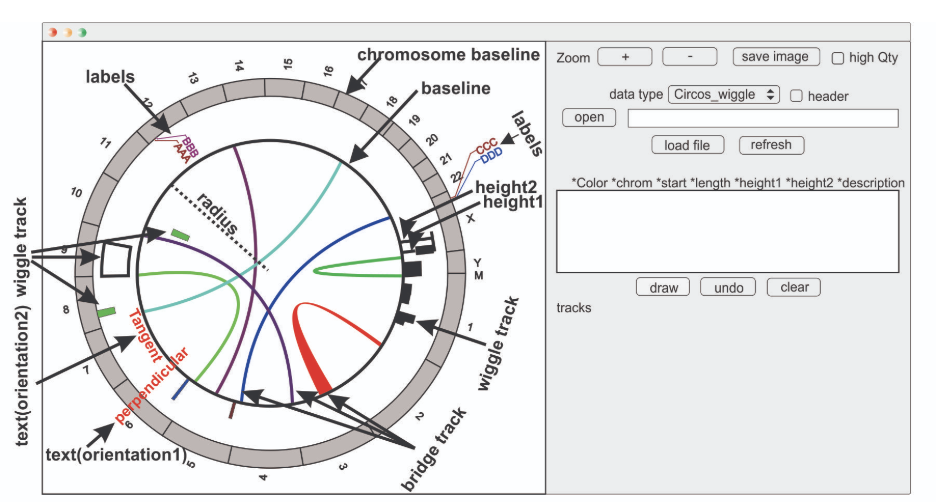
Circos plots are graphical outputs that display three dimensional chromosomal interactions and fusion transcripts. However, the Circos plot tool is not an interactive visualization tool, but rather a figure generator. For example, it does not enable data to be added dynamically nor does it provide information for specific data points interactively. Recently, an R-based Circos tool (RCircos) has been developed to integrate Circos to R, but similarly, Rcircos can only be used to generate plots. Thus, we have developed a Circos plot tool (J-Circos) that is an interactive visualization tool that can plot Circos figures, as well as being able to dynamically add data to the figure, and providing information for specific data points using mouse hover display and zoom in/out functions. J-Circos uses the Java computer language to enable, it to be used on most operating systems (Windows, MacOS, Linux). Users can input data into J-Circos using flat data formats, as well as from the Graphical user interface (GUI). J-Circos will enable biologists to better study more complex chromosomal interactions and fusion transcripts that are otherwise difficult to visualize from next-generation sequencing data.
 http://www.australianprostatecentre.org/research/software/jcircos