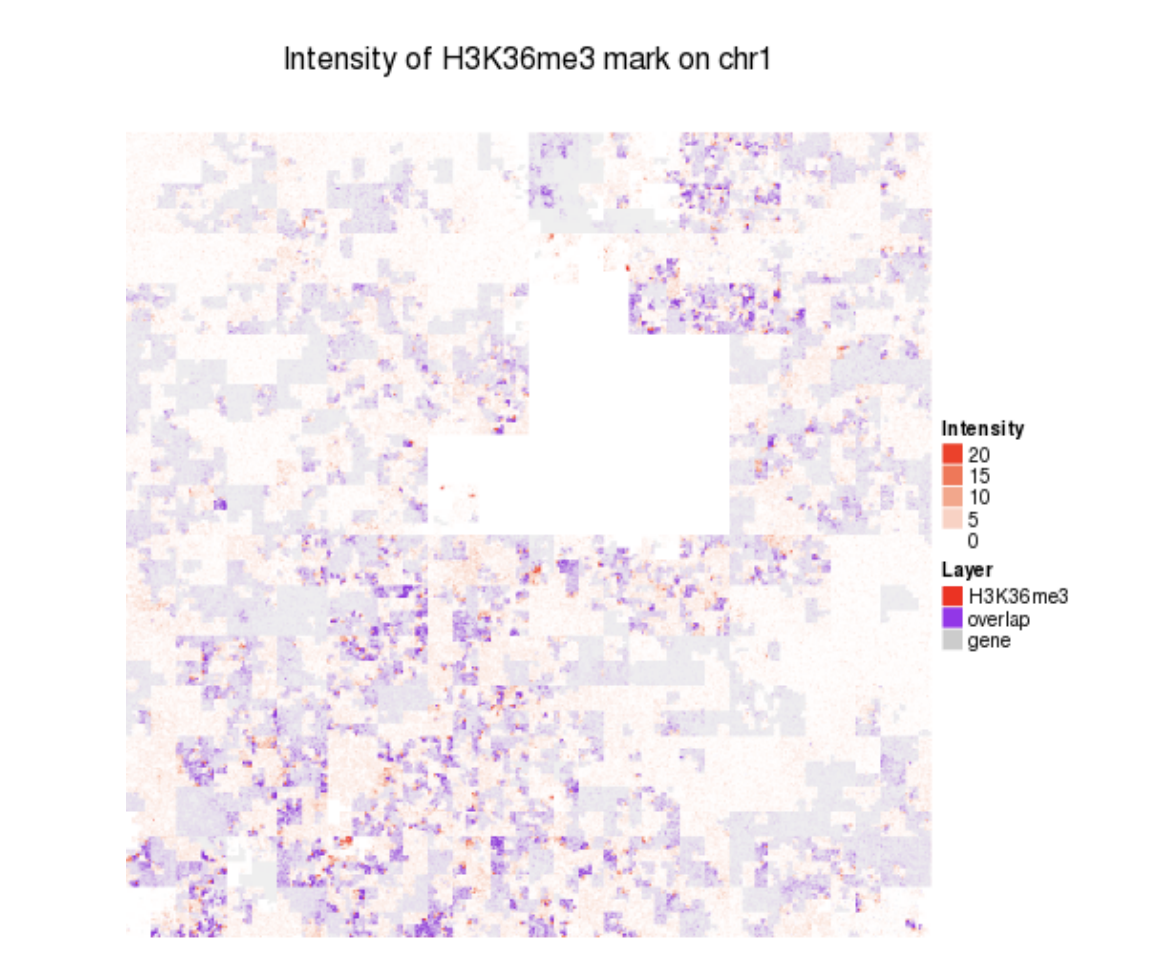
HilbertCurve
 https://arxiv.org/pdf/1905.02853.pdf
Methods
spacefilling single view single scale single focus contiguous no abstraction no arrangement no interconnection segment sparse type segment contiguous type point sparse type point contiguous typeTool
Tool:
HilbertCurvePaper
HilbertCurve: an R/Bioconductor package for high-resolution visualization of genomic data.
Gu Z, Eils R, Schlesner M. HilbertCurve: an R/Bioconductor package for high-resolution visualization of genomic data. Bioinformatics. academic.oup.com; 2016;32: 2372–2374.
Cited by: 6