BedSect: An Integrated Web Server Application to Perform Intersection, Visualization, and Functional Annotation of Genomic Regions From Multiple Datasets
Mishra, Gyan Prakash, et al. BedSect: An Integrated Web Server Application to Perform Intersection, Visualization, and Functional Annotation of Genomic Regions From Multiple Datasets. Frontiers in Genetics 11 (2020): 3.
Cited by: 26
Abstract
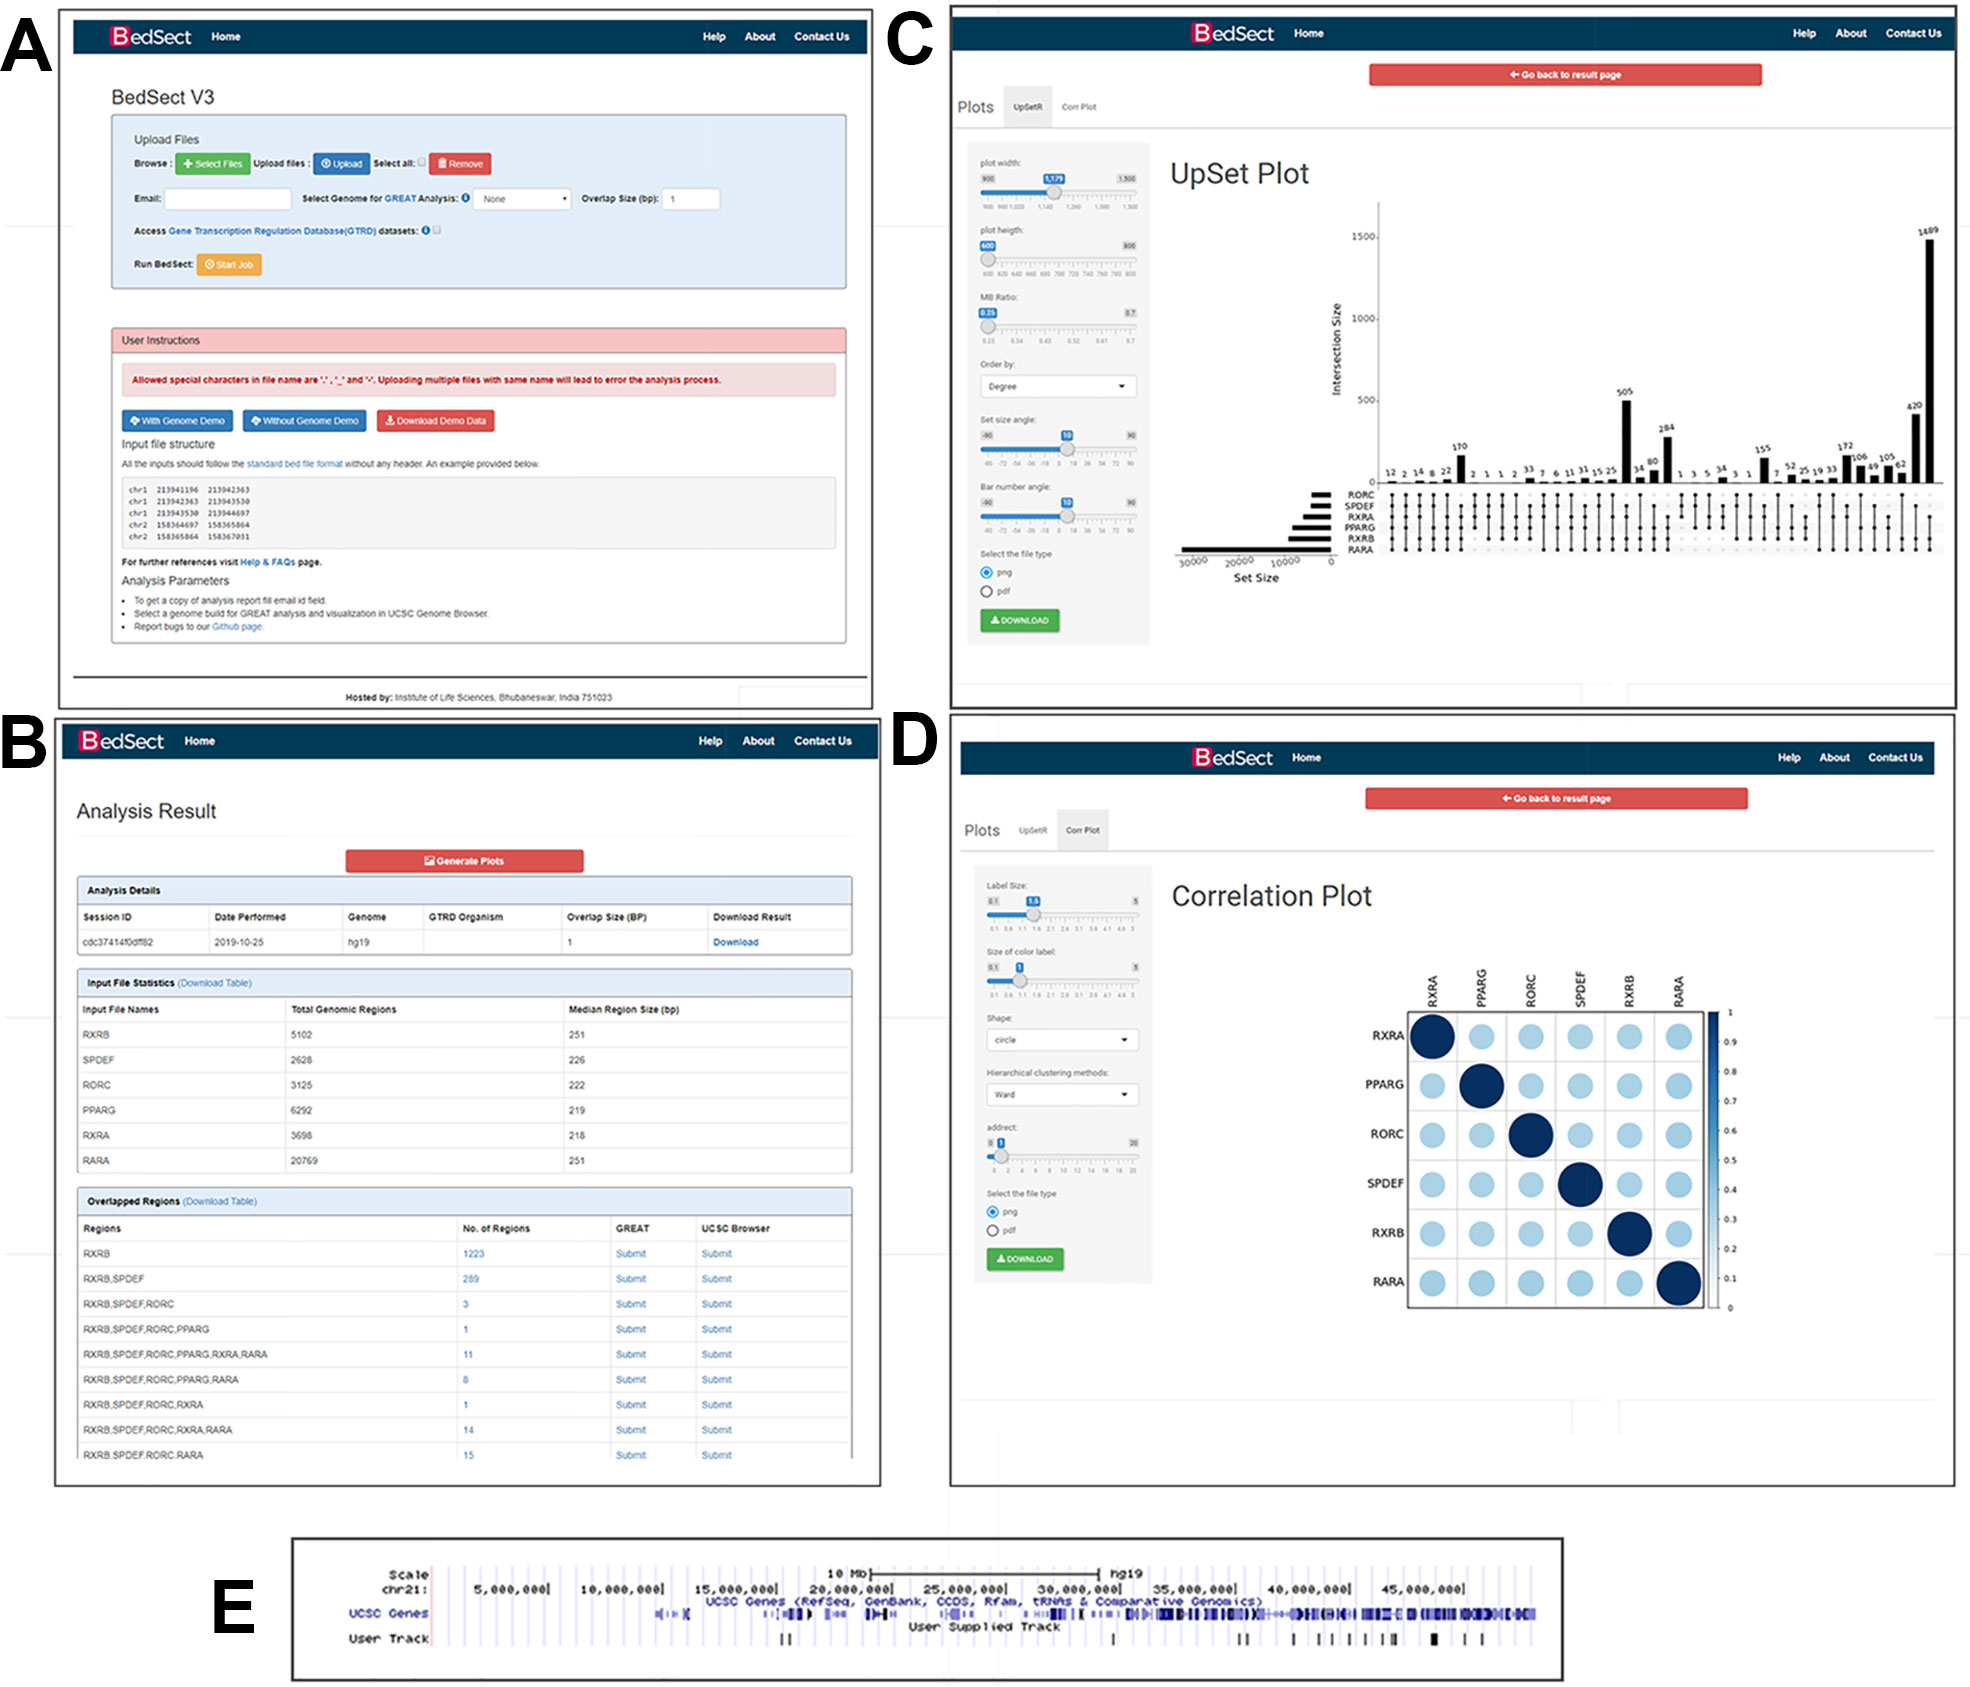
A large number of genomic regions, such as transcription factor binding sites (TFBSs) captured from next generation sequencing (NGS) data analyses or those available from the public resource database ENCODE, are generally overlapped to answer a variety of biological questions. Though several command-line tools are available to perform such an analysis, there is a notable lack of an integrated webserver application with which to identify genomic region intersections, generate publication-ready plots depicting subsets of the overlapped regions, and perform functional annotation. Thus, there is an ardent need for a comprehensive and user-friendly webserver application that allows the users to either upload multiple datasets or select from the integrated Gene Transcription Regulation Database (GTRD). We thus introduce BedSect (http://imgsb.org/bedsect/.), which not only fulfils the above criteria but also performs intersection analysis along with visualization of the intersection regions as an UpSet and correlation plot using the integrated Shiny application. Moreover, analyses, including functional annotation, gene ontology, and biological pathways enrichment for the identified unique and intersected genomic regions, can also be performed using the integrated GREAT tool. To view the genomic regions in the genome browser, the inbuilt hyperlink for UCSC can redirect the user to visualize the results as custom tracks.
 https://www.frontiersin.org/files/Articles/510221/fgene-11-00003-HTML/image_m/fgene-11-00003-g002.jpg