
trackViewer
 https://bioconductor.org/packages/release/bioc/vignettes/trackViewer/inst/doc/trackViewer.html
Methods
linear multiple view multiple scale multiple focus segregated partial abstraction linear parallel arrangement within interconnection segment sparse type point contiguous type point sparse type segment contiguous typeTool
| Access Format | “programming library” |
| Supported Files | bed |
| License | GPL |
| Tool name | trackViewer |
| Tool Link | https://bioconductor.org/packages/release/bioc/html/trackViewer.html |
| Documentation | https://bioconductor.org/packages/release/bioc/vignettes/trackViewer/inst/doc/trackViewer.html |
Paper
trackViewer: a Bioconductor package for interactive and integrative visualization of multi-omics data
Ou J, Zhu LJ. trackViewer: a Bioconductor package for interactive and integrative visualization of multi-omics data. Nature methods. 2019 Jun;16(6):453-4.
Abstract
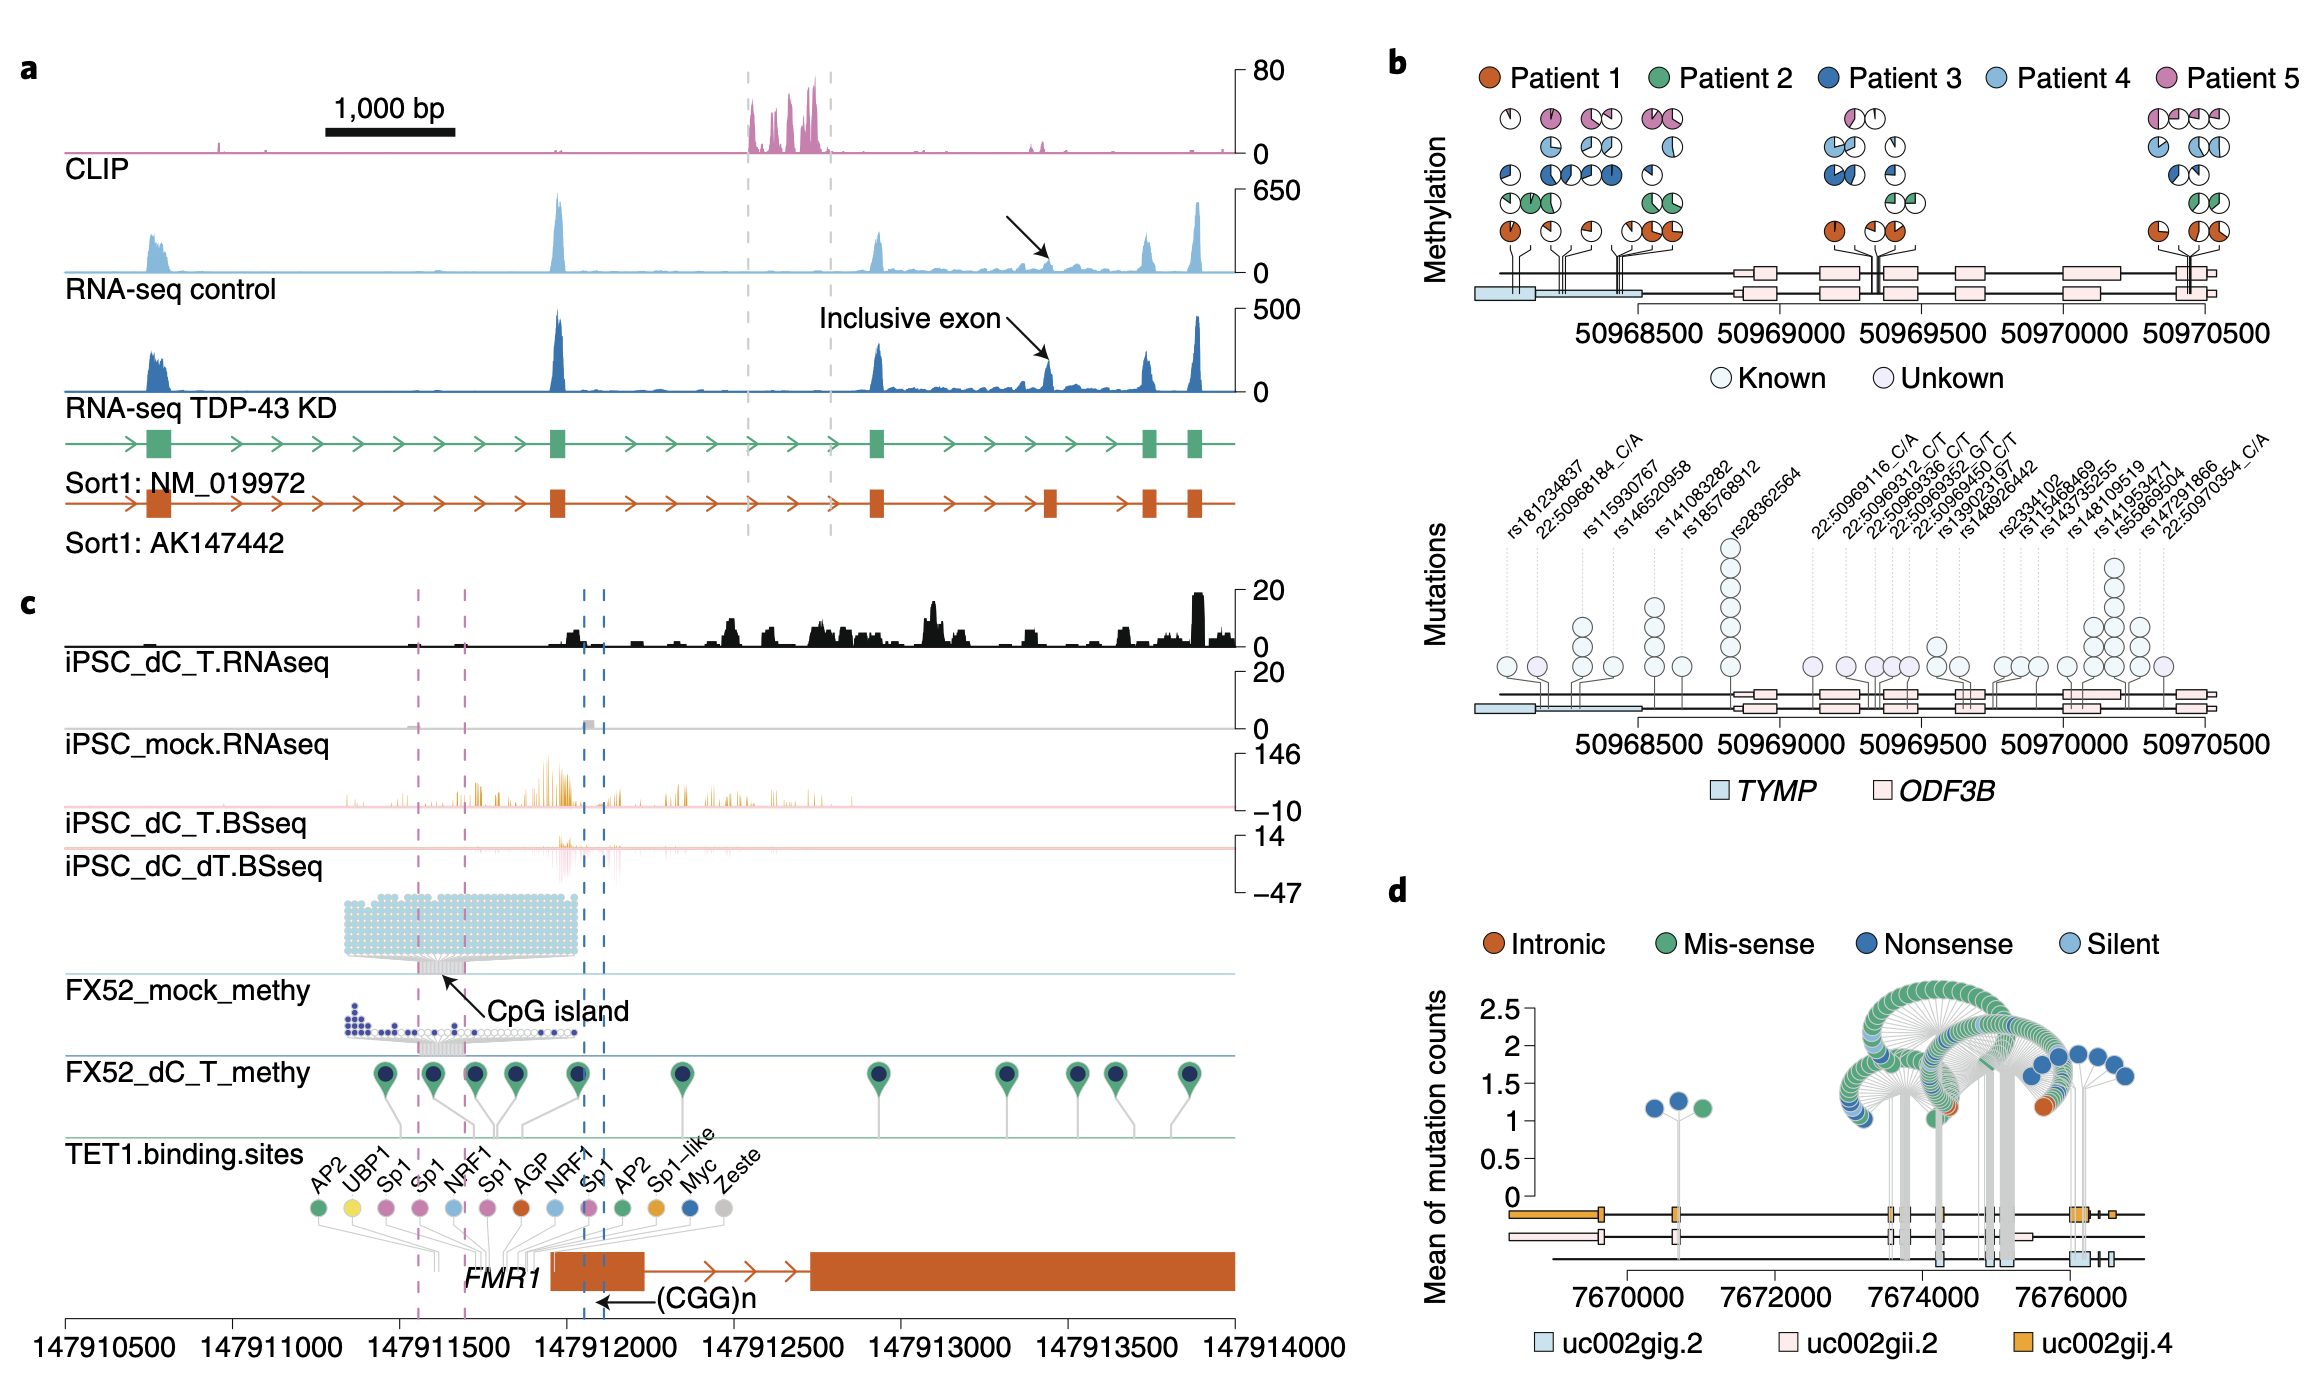
As high-throughput sequencing’s cost continues to decrease and its applications continue to grow, the amount of data and the number of data types produced by this method are expected to constantly expand. To integrate various types of data and generate hypotheses efficiently, researchers increasingly need concise and meaningful depictions of diverse, complex datasets. Several genome browsers and viewers have been developed for the visualization of genomic data1–3, but the majority of those tools do not have an easy programming interface that can be plugged into a pipeline. In addition, methylation, mutation, and single-nucleotide polymorphism (SNP) data require a special type of plot, called a lollipop or needle plot, to concisely depict the methylation, mutation, and SNP status. Although several tools have been developed to generate stand-alone lollipop plots (reviewed in ref. 4), all the genome browsers lack this function. In addition, it is difficult to use existing lollipop-plot tools to visualize dense mutation/SNP and methylation data. Here we describe trackViewer, a Bioconductor package for the visualization of multi-omics data that can be integrated into any analysis pipeline in R