
RIdeogram
 https://plobimage.ybzhao.com/wp-content/uploads/2019/01/1548519408-7286-nBs1pFD4O2SWkn1DMqbYdbTfarUA.jpg
Methods
linear single view single scale single focus segregated no abstraction linear parallel arrangement no interconnection segment sparse typeTool
| Access Format | standalone app |
| Supported Files | other |
| License | Artistic-2.0 |
| Tool name | RIdeogram |
| Tool Link | https://cran.r-project.org/web/packages/RIdeogram/ |
| Documentation | https://cran.r-project.org/web/packages/RIdeogram/vignettes/RIdeogram.html |
Paper
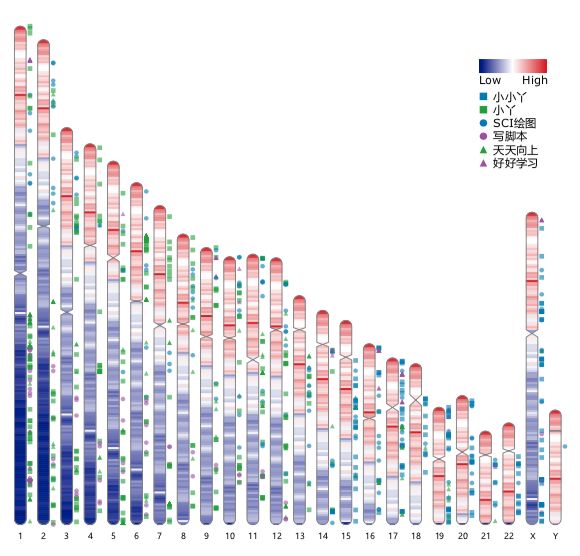
RIdeogram: drawing SVG graphics to visualize and map genome-wide data on the idiograms
Hao Z, Lv D, Ge Y, Shi J, Weijers D, Yu G, Chen J. 2020. RIdeogram: drawing SVG graphics to visualize and map genome-wide data on the idiograms. PeerJ Computer Science 6:e251 https://doi.org/10.7717/peerj-cs.251
Abstract
Owing to the rapid advances in DNA sequencing technologies, whole genome from more and more species are becoming available at increasing pace. For whole-genome analysis, idiograms provide a very popular, intuitive and effective way to map and visualize the genome-wide information, such as GC content, gene and repeat density, DNA methylation distribution, genomic synteny, etc. However, most available software programs and web servers are available only for a few model species, such as human, mouse and fly, or have limited application scenarios. As more and more non-model species are sequenced with chromosome-level assembly being available, tools that can generate idiograms for a broad range of species and be capable of visualizing more data types are needed to help better understanding fundamental genome characteristics.