
HilbertCurve
 https://arxiv.org/pdf/1905.02853.pdf
Methods
spacefilling single view single scale single focus contiguous no abstraction no arrangement no interconnection segment sparse type segment contiguous type point sparse type point contiguous typeTool
| Access Format | programming library |
| Supported Files | other |
| License | MIT |
| Tool name | HilbertCurve |
| Tool Link | https://bioconductor.org/packages/release/bioc/html/HilbertCurve.html |
| Documentation | https://bioconductor.org/packages/release/bioc/vignettes/HilbertCurve/inst/doc/HilbertCurve.html |
Paper
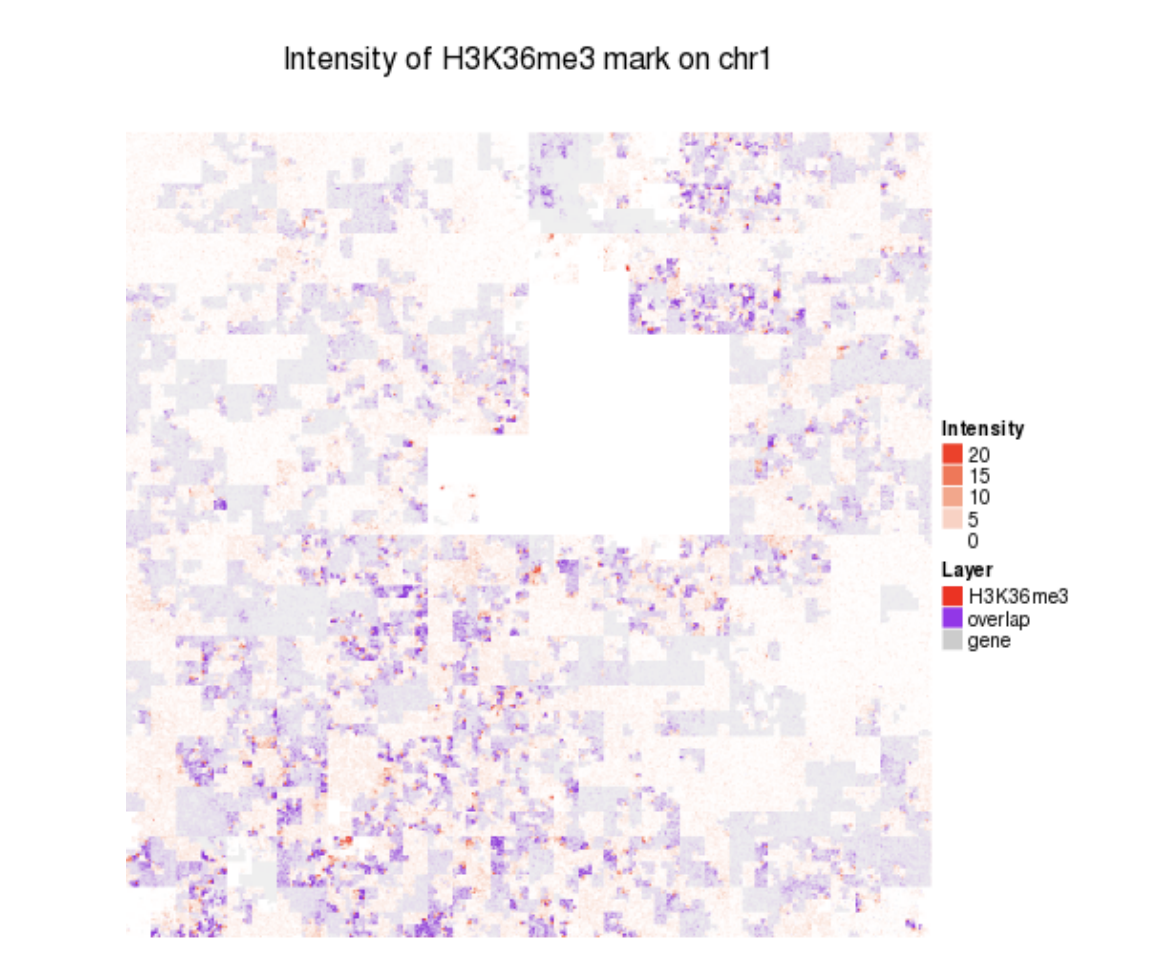
HilbertCurve: an R/Bioconductor package for high-resolution visualization of genomic data.
Gu Z, Eils R, Schlesner M. HilbertCurve: an R/Bioconductor package for high-resolution visualization of genomic data. Bioinformatics. academic.oup.com; 2016;32: 2372–2374.
Abstract
Hilbert curves enable high-resolution visualization of genomic data on a chromosome- or genome-wide scale. Here we present the HilbertCurve package that provides an easy-to-use interface for mapping genomic data to Hilbert curves. The package transforms the curve as a virtual axis, thereby hiding the details of the curve construction from the user. HilbertCurve supports multiple-layer overlay that makes it a powerful tool to correlate the spatial distribution of multiple feature types.