
EpiViz
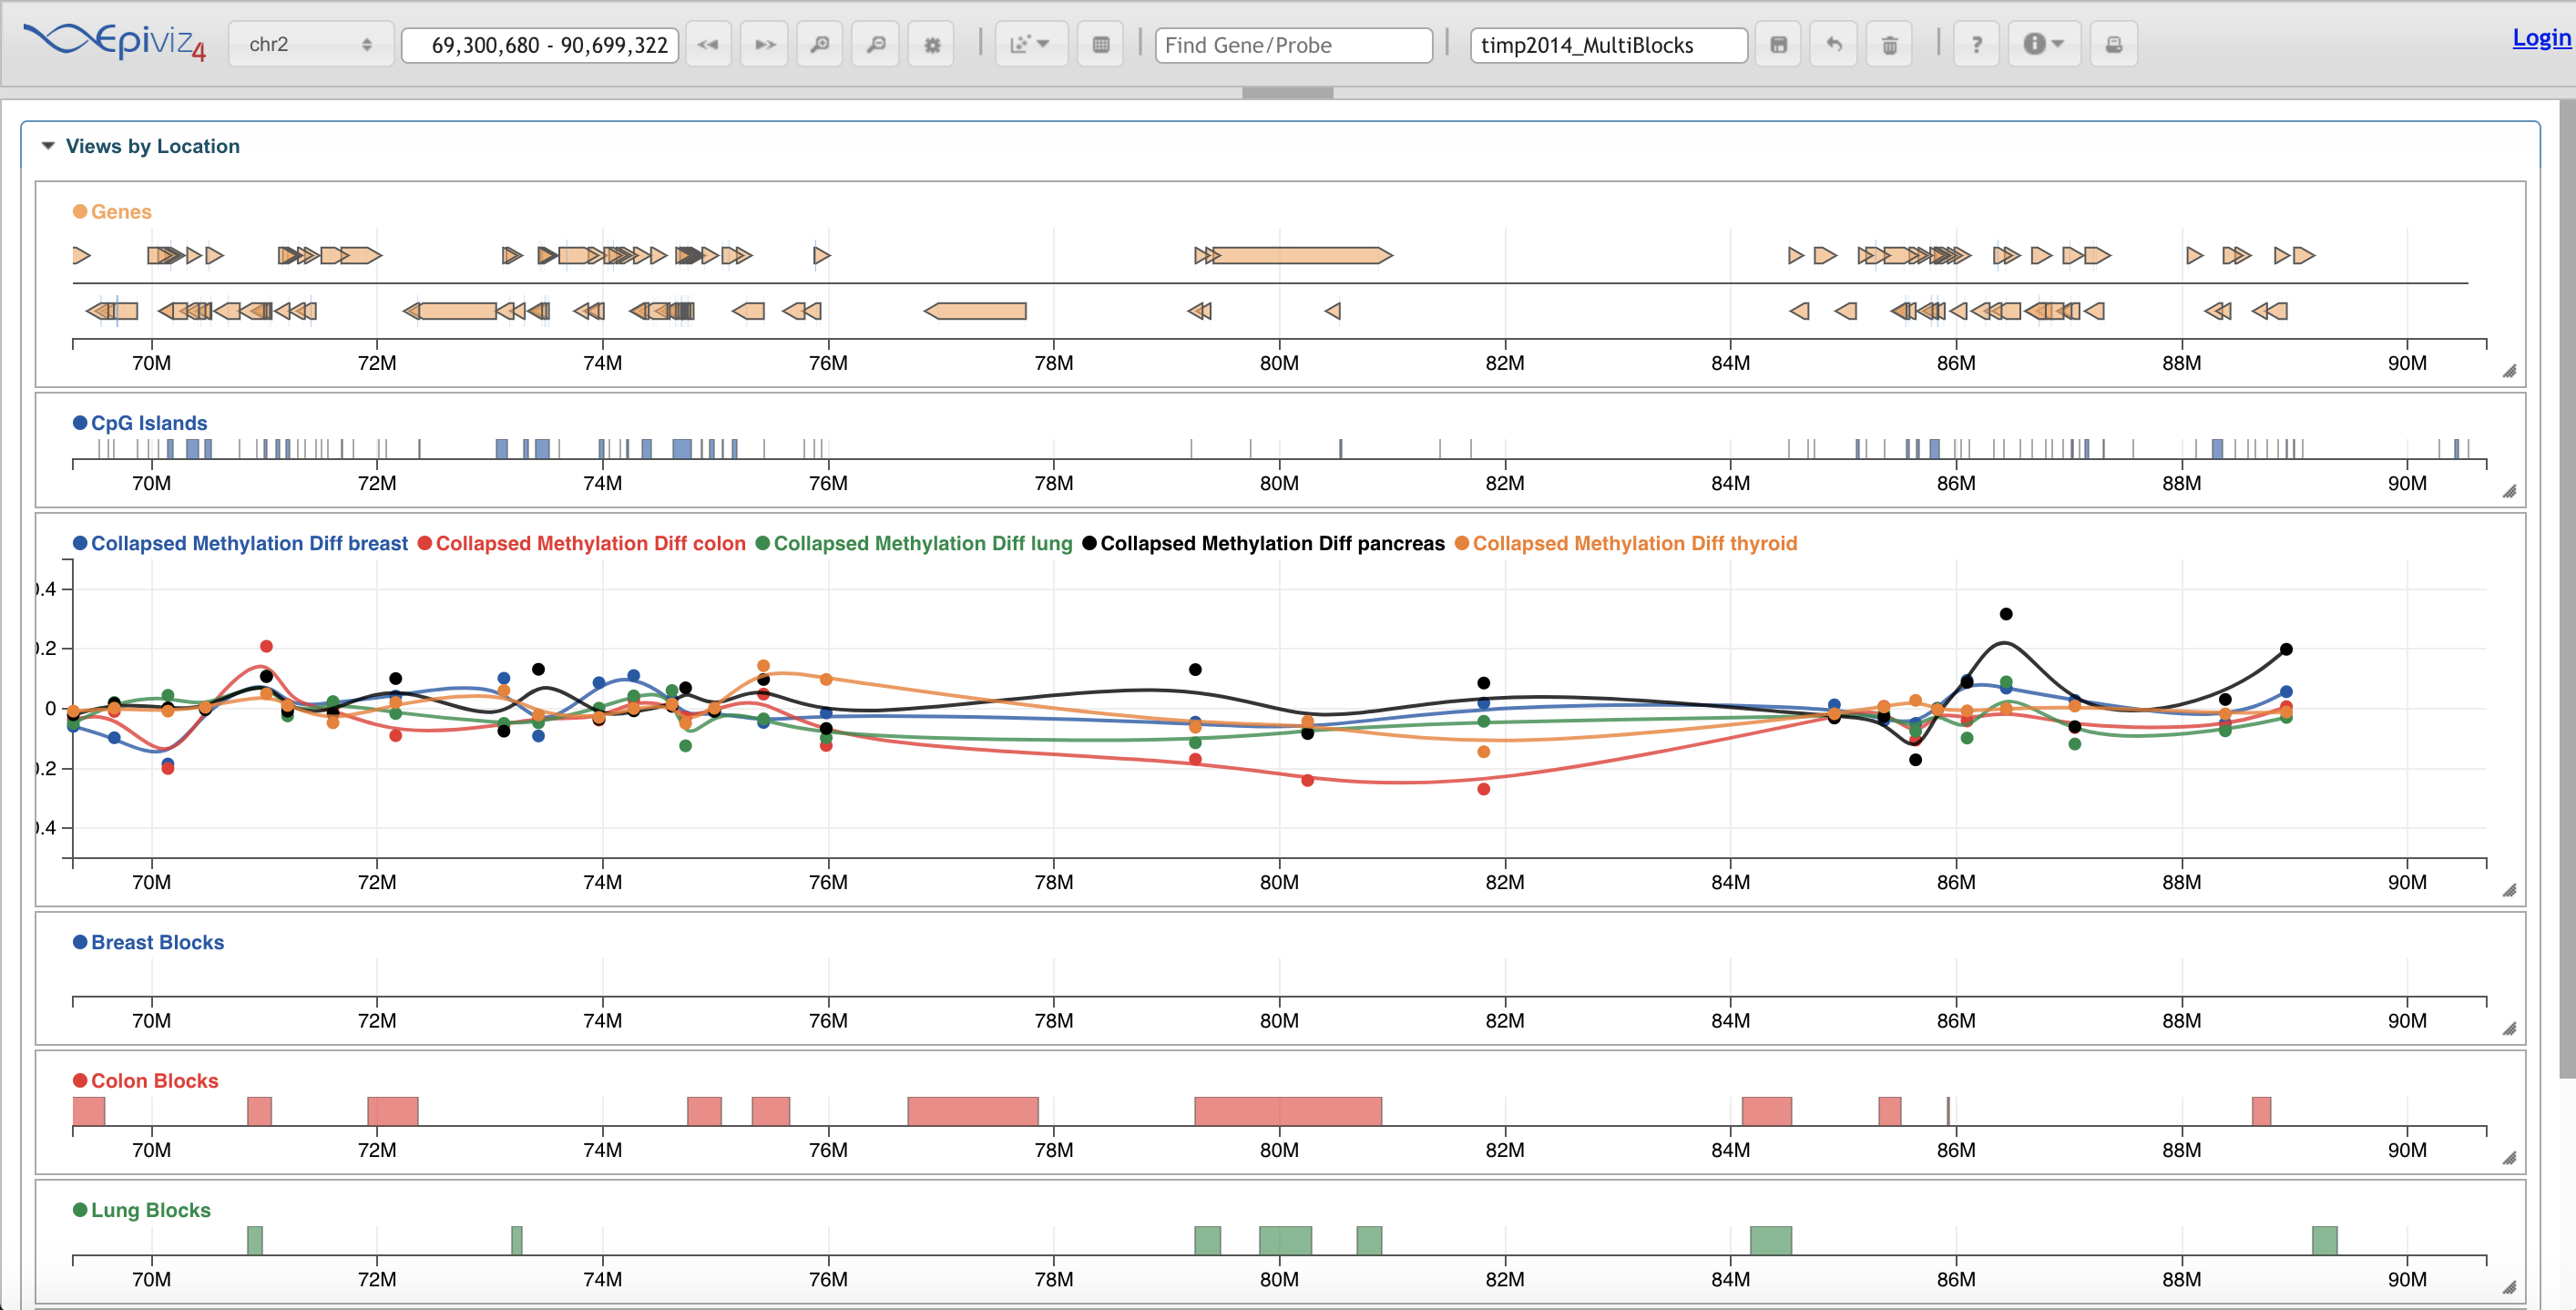 http://epiviz.cbcb.umd.edu/4/?ws=Ago25FdPLVb&seqName=chr2&start=69300680&end=90699322&settings=default&useCookie=true&
Methods
linear single view single scale single focus segregated no abstraction no arrangement no interconnection segment sparse type segment contiguous type point sparse type point contiguous typeTool
| Access Format | web application standalone app programming library |
| Supported Files | other |
| License | Artistic License |
| Tool name | EpiViz |
| Tool Link | https://epiviz.github.io/ |
| Documentation | https://epiviz.github.io/documentation/ |
Paper
Epiviz: interactive visual analytics for functional genomics data
Chelaru F, Smith L, Goldstein N, Bravo HC. Epiviz: interactive visual analytics for functional genomics data. Nat Methods. nature.com; 2014;11: 938–940.
Abstract
Visualization is an integral aspect of genomics data analysis where the output of procedures performed in computing environments like Bioconductor is often visualized. Algorithmic-statistical analysis and interactive visualization are usually disjoint but are most effective when used iteratively. We introduce tools that provide this tight-knit integration: Epiviz (http://epiviz.cbcb.umd.edu), a web-based genome browser, and the Epivizr Bioconductor package allowing interactive, extensible and reproducible visualization within a state-of-the-art data analysis platform.