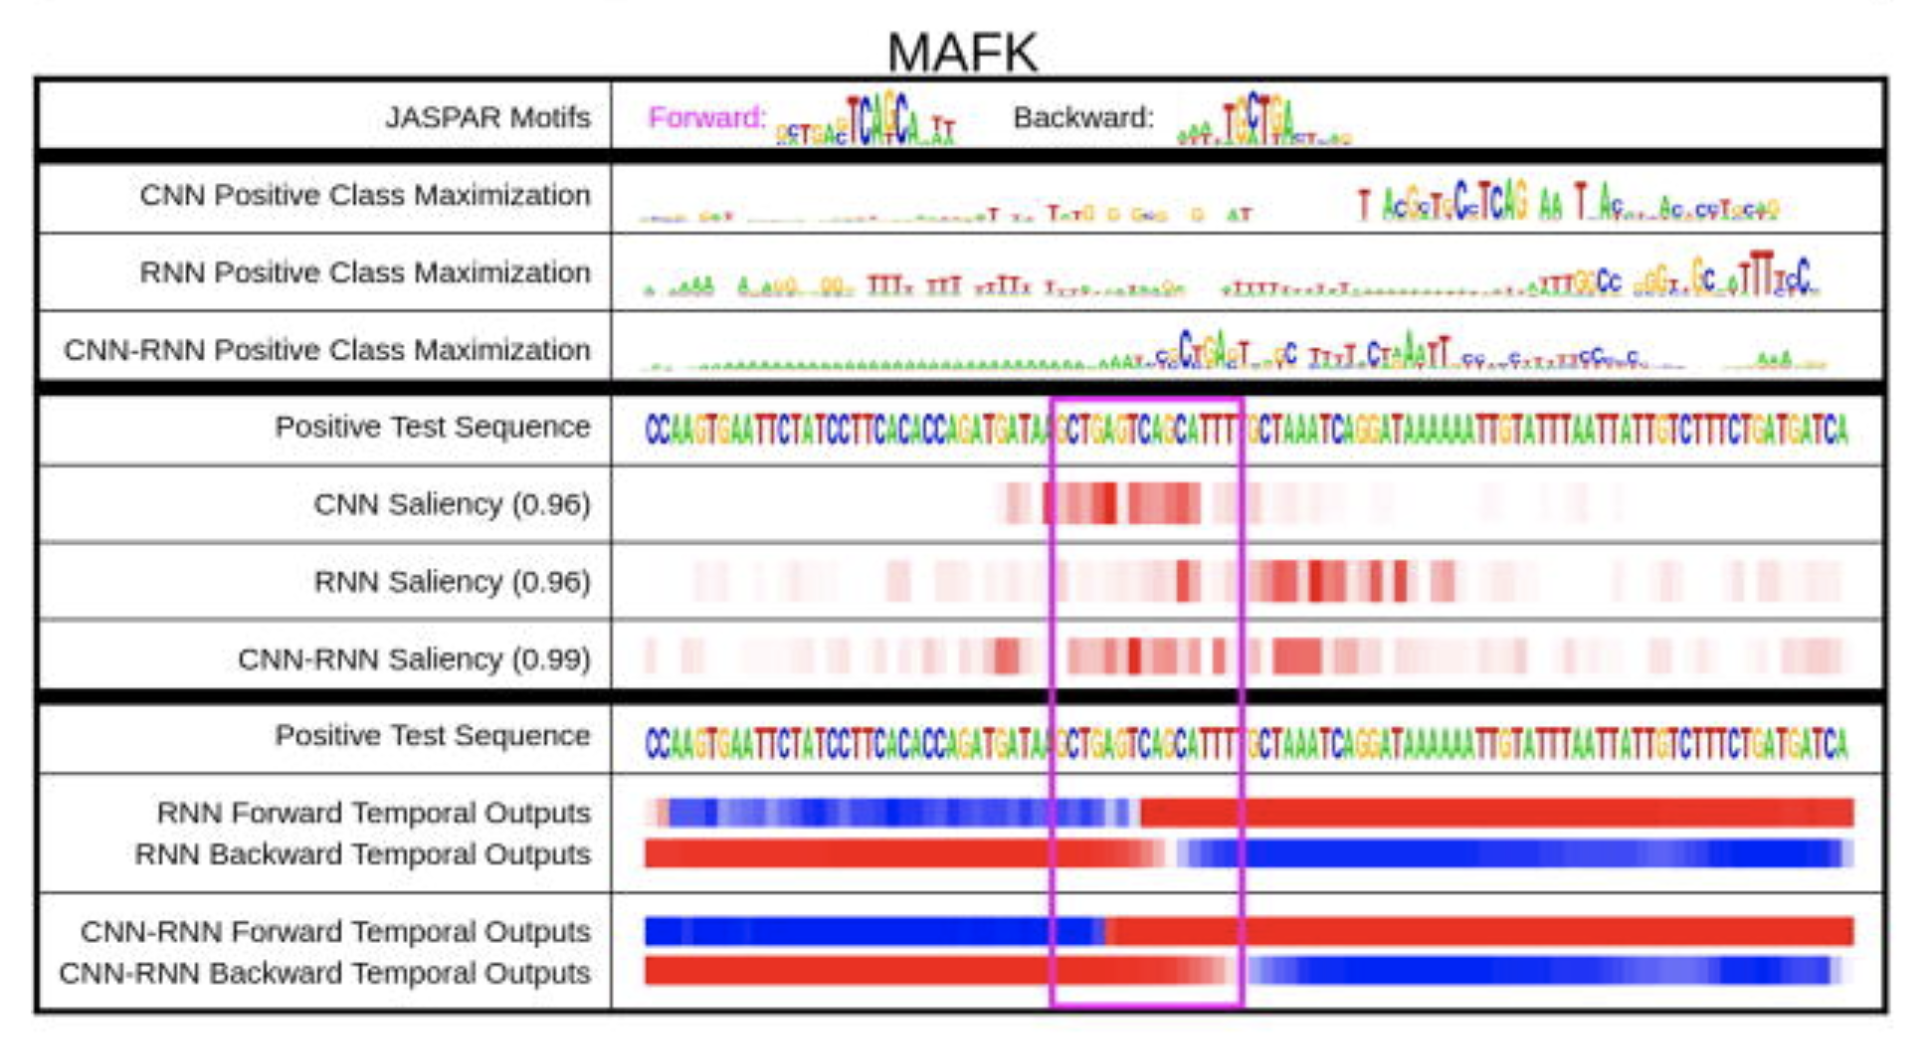
Deep Motif Dashboard
 https://www.ncbi.nlm.nih.gov/pmc/articles/PMC5787355/figure/F2/
Methods
linear single view single scale single focus contiguous no abstraction no arrangement no interconnection segment contiguous type point contiguous typeTool
| Access Format | standalone app |
| Supported Files | other |
| License | MIT |
| Tool name | Deep Motif Dashboard |
| Tool Link | https://qdata.github.io/deep4biomed-web// |
| Documentation | https://github.com/QData/DeepMotif/blob/master/README.md |
Paper
DEEP MOTIF DASHBOARD: VISUALIZING AND UNDERSTANDING GENOMIC SEQUENCES USING DEEP NEURAL NETWORKS.
Lanchantin J, Singh R, Wang B, Qi Y. DEEP MOTIF DASHBOARD: VISUALIZING AND UNDERSTANDING GENOMIC SEQUENCES USING DEEP NEURAL NETWORKS. Pac Symp Biocomput. 2017;22: 254–265.
Abstract
Deep neural network (DNN) models have recently obtained state-of-the-art prediction accuracy for the transcription factor binding (TFBS) site classification task. However, it remains unclear how these approaches identify meaningful DNA sequence signals and give insights as to why TFs bind to certain locations. In this paper, we propose a toolkit called the Deep Motif Dashboard (DeMo Dashboard) which provides a suite of visualization strategies to extract motifs, or sequence patterns from deep neural network models for TFBS classification. We demonstrate how to visualize and understand three important DNN models: convolutional, recurrent, and convolutional-recurrent networks. Our first visualization method is finding a test sequence's saliency map which uses first-order derivatives to describe the importance of each nucleotide in making the final prediction. Second, considering recurrent models make predictions in a temporal manner (from one end of a TFBS sequence to the other), we introduce temporal output scores, indicating the prediction score of a model over time for a sequential input. Lastly, a class-specific visualization strategy finds the optimal input sequence for a given TFBS positive class via stochastic gradient optimization. Our experimental results indicate that a convolutional-recurrent architecture performs the best among the three architectures. The visualization techniques indicate that CNN-RNN makes predictions by modeling both motifs as well as dependencies among them.