HilbertVis
 https://bioconductor.riken.jp/packages/3.5/bioc/vignettes/HilbertVis/inst/doc/HilbertVis.pdf
Methods
spacefilling single view single scale single focus contiguous no abstraction no arrangement no interconnection segment sparse type segment contiguous type point sparse type point contiguous typeTool
| Access Format | programming library |
| Supported Files | other |
| License | GPL |
| Tool name | HilbertVis |
| Tool Link | https://bioconductor.org/packages/release/bioc/html/HilbertVis.html |
| Documentation | https://bioconductor.riken.jp/packages/3.5/bioc/vignettes/HilbertVis/inst/doc/HilbertVis.pdf |
Paper
Visualization of genomic data with the Hilbert curve
Anders S. Visualization of genomic data with the Hilbert curve. Bioinformatics. academic.oup.com; 2009;25: 1231–1235.
Abstract
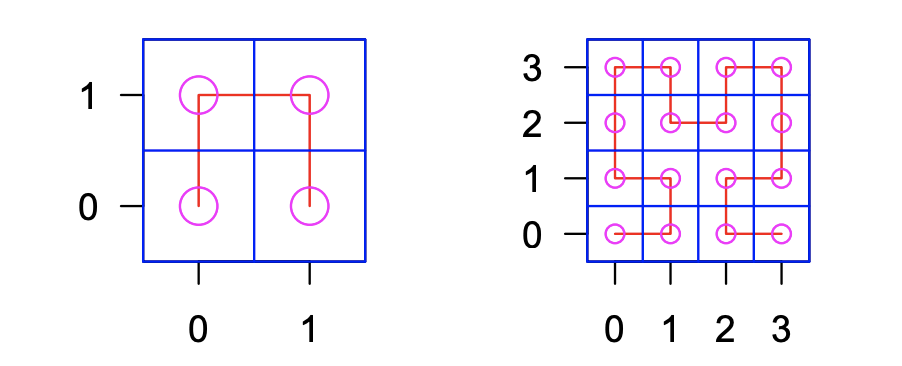
In many genomic studies, one works with genome-position-dependent data, e.g. ChIP-chip or ChIP-Seq scores. Using conventional tools, it can be difficult to get a good feel for the data, especially the distribution of features. This article argues that the so-called Hilbert curve visualization can complement genome browsers and help to get further insights into the structure of one's data. This is demonstrated with examples from different use cases. An open-source application, called HilbertVis, is presented that allows the user to produce and interactively explore such plots.